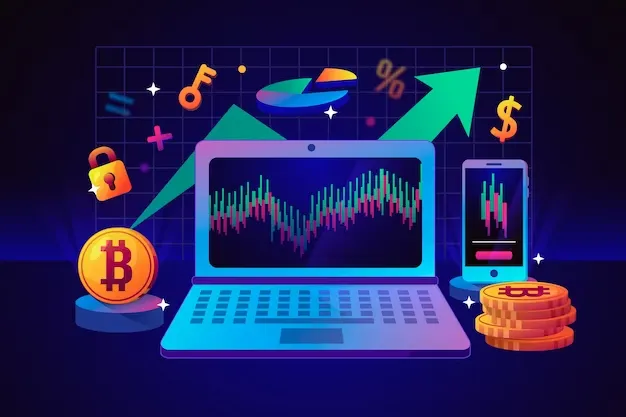
For those just starting out, cryptocurrency trading might seem like a daunting challenge, but worry not! With the right tools and knowledge at your disposal, it can become a far more manageable endeavor. Among these valuable tools, Bollinger Bands stand out as a crucial aid for traders, providing essential insights for making informed decisions in the world of cryptocurrency trading.
In this article, we're going to delve into the world of Bollinger Bands, helping you understand what they are and, more importantly, how to effectively harness their power in the exciting realm of cryptocurrency trading. So, let's embark on this journey to unlock the secrets of Bollinger Bands and how they can be your ally in the world of digital assets.
What Are Bollinger Bands and Their Use in Cryptocurrency Trading?
Bollinger Bands: An Introduction
Before delving into the realm of Bollinger Bands, it's essential to grasp the fundamentals. John Bollinger introduced these bands in the 1980s, and they have since become a fundamental tool in the world of cryptocurrency trading and other financial markets. These bands comprise three key elements:
- Upper Band: Calculated by multiplying the middle band by the standard deviation of the price, it quantifies price volatility.
- Middle Band (SMA): Represents the average price of a cryptocurrency over a specific period.
- Lower Band: Determined by subtracting a multiple of the standard deviation from the middle band.
The Role of Bollinger Bands in Cryptocurrency Trading
In cryptocurrency trading, Bollinger Bands serve as a critical technical analysis technique for traders in several ways:
- Evaluating Price Volatility: Traders can assess price volatility by observing the width of the Bollinger Bands. A widening of the bands indicates increased volatility, while a contraction suggests a potential price consolidation or trend shift.
- Identifying Overbought and Oversold Conditions: Bollinger Bands are excellent tools for spotting overbought and oversold scenarios. A potential selling opportunity emerges when the price exceeds the upper band (indicating overbought conditions) and a buying opportunity presents itself when the price falls below the lower band (signaling oversold conditions).
- Determining the Trend Direction: Traders can use Bollinger Bands to determine the prevailing trend. A consistent movement along the upper band suggests an uptrend, while frequent touches or closeness to the lower band indicate a downtrend.
- Generating Reversal Signals: Bollinger Bands can be employed to create signals for potential trend reversals. For instance, when the price moves outside the bands and then re-enters (above the upper band for an uptrend or below the lower band for a downtrend), this may indicate a possible reversal.
Constructing Bollinger Bands: A Step-by-Step Guide
Step 1: Calculate the Simple Moving Average (SMA)
Traders begin by selecting a specific time frame and collecting the previous closing prices of the cryptocurrency they are analyzing. The SMA is determined by summing these closing prices for the chosen time frame and dividing the total by the number of data points.
Step 2: Calculate the Standard Deviation (SD)
Once the SMA is calculated, traders calculate the standard deviation (SD) of the closing prices over the same period. SD is vital for evaluating price volatility.
Step 3: Building the Upper and Lower Bands
To create the upper band, traders multiply the Simple Moving Average (SMA) by a specific multiple of the standard deviation. Traditionally, a multiplier of 2 is employed; nevertheless, this multiplier can be fine-tuned to align with the current market conditions and individual preferences. Calculating the lower band involves a straightforward subtraction of the same multiple of the standard deviation from the SMA. This approach offers flexibility and adaptability in response to market dynamics and personal trading strategies.
Step 4: Plotting Bollinger Bands on a Price Chart
After calculating the components, traders can plot the SMA, standard deviation, upper Bollinger Band, and lower Bollinger Band on a price chart. The central line, which is the SMA, is represented by the middle band. This creates a channel that envelops the price chart, formed by the upper and lower bands.
Step 5: Interpretation
Understanding how to interpret Bollinger Bands is essential. For example, when the price touches or exceeds the upper band, it may indicate an overbought condition and a potential selling opportunity. Conversely, touching or falling below the lower band may signal an oversold market, suggesting a potential buying opportunity. The width of the bands provides insights into market volatility, with wider bands indicating higher volatility and narrower bands indicating lower volatility.
Trading Strategies with Bollinger Bands

Cryptocurrency traders commonly use several trading strategies involving Bollinger Bands.
1. Bollinger Band Squeeze Strategy for Cryptocurrencies
This approach capitalizes on periods of low volatility followed by high volatility. Here's how it works:
- Identify the Squeeze: Watch for times when the Bollinger Bands narrow, indicating reduced price volatility.
- Prepare for the Breakout: After a squeeze, traders anticipate a significant price movement and prepare for it.
- Entry Points: Traders enter positions after price breakouts from the Bollinger Bands, often using additional indicators for confirmation.
- Stop-Loss and Take-Profit Levels: Implement stop-loss orders to limit potential losses and set take-profit levels according to your trading strategy.
2. Using Bollinger Bands for Entry and Exit Points
Whether you're trading cryptocurrencies for short-term gains or day trading, Bollinger Bands can assist in finding the best entry and exit points:
- Entry Points: Buy when the price reaches or falls below the lower Bollinger Band (indicating oversold conditions) or sell when it reaches or exceeds the upper Bollinger Band (signifying overbought conditions). Additional technical research and validation may be necessary.
- Exit Points: Use Bollinger Bands to determine when to close a position. For instance, consider taking profits when the price nears the upper band after taking a long position or closing a trade if the price approaches the lower band in a short position.
Combining Bollinger Bands with Other Indicators
Traders often use Bollinger Bands in conjunction with other indicators for more robust analysis:
- Bollinger Bands and RSI: Combining Bollinger Bands with the Relative Strength Index (RSI) helps detect potential reversals when the price nears the upper Bollinger Band and RSI indicates overbought conditions.
- Volume Analysis: The addition of volume analysis can confirm price fluctuations. Increased volume during a Bollinger Band breakout reinforces the signal's validity.
- Bollinger Bands and Moving Averages: Using moving averages alongside Bollinger Bands adds context to trend analysis. Combining Bollinger Bands with a moving average crossover strategy can help validate trend changes.
Limitations of Bollinger Bands
While Bollinger Bands are valuable tools for cryptocurrency trading, they have limitations:
- They can produce false signals during periods of low volatility or strong trends, potentially leading to losses.
- Bollinger Bands do not provide directional information by themselves, necessitating the use of other indicators to confirm trend direction.
- Their effectiveness can vary between different cryptocurrencies and timeframes.
- Price gaps, which are not reflected in the bands, can catch traders off guard during unexpected market events.
Risk Management with Bollinger Bands
To reduce potential losses, it's crucial to use Bollinger Bands in conjunction with risk management strategies:
- Set explicit stop-loss orders.
- Properly size your positions to avoid overexposure.
- Diversify your holdings across different cryptocurrencies.
- Limit the percentage of your total capital that can be lost in a single trade.
Conclusion
In conclusion, Bollinger Bands provide a valuable tool for cryptocurrency trading, enabling traders to gain a deeper understanding of price volatility, pinpoint potential entry and exit opportunities, and validate the direction of market trends. By seamlessly integrating Bollinger Bands with other essential indicators and adhering to prudent risk management strategies, traders can significantly bolster their odds of achieving success in the dynamic cryptocurrency market. So, as you venture forth, remember to apply these insights, and may your cryptocurrency trading journey be filled with profitable endeavors. Happy trading!
